Building a Home SOC on k3s: Falco, Trivy, Prometheus & Telegram Alerts — All in GitOps
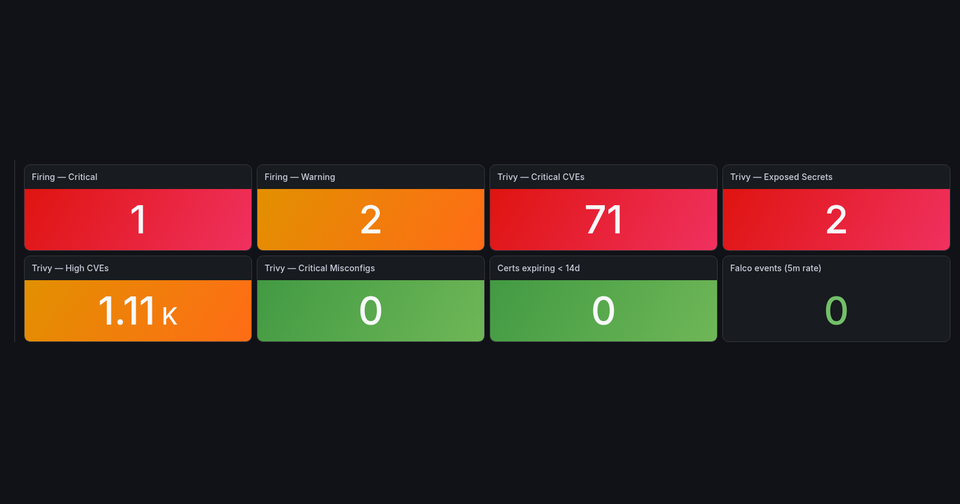
This is the full build log of turning a single-node k3s homelab into a working, GitOps-managed Security Operations Center (SOC). Everything here is declarative — reconciled by Flux from Git — so the whole stack is reproducible and auditable. The design follows the four SOC functions: collect → detect → alert → isolate.
The stack
- Telemetry: kube-prometheus-stack (Prometheus + Grafana), Loki + Grafana Alloy for logs
- Detection: Falco (runtime/syscall) + Trivy Operator (image vulnerabilities, misconfigurations, exposed secrets)
- Alerting: Alertmanager → Telegram
- Isolation: Kubernetes NetworkPolicies (default-deny on the crown jewels)
- Edge: Traefik behind a Cloudflare Tunnel, cert-manager for TLS
- Secrets: Vault + External Secrets Operator (nothing sensitive in Git)
1. Alerting: Alertmanager → Telegram
Detection is worthless without a channel out. First stop: turn Alertmanager on and route everything to Telegram. The bot token comes from Vault via an ExternalSecret and is mounted into Alertmanager; the chat_id is not secret but must be an unquoted integer — a quoted string fails to unmarshal and the Alertmanager pod never starts.
# infrastructure/monitoring/helm-release.yaml (kube-prometheus-stack values)
alertmanager:
  enabled: true
  alertmanagerSpec:
    secrets:
      - alertmanager-telegram          # bot token mounted from this secret
    storage:
      volumeClaimTemplate:
        spec:
          storageClassName: local-path
          accessModes: ["ReadWriteOnce"]
          resources:
            requests:
              storage: 1Gi
  config:
    global:
      resolve_timeout: 5m
    route:
      receiver: telegram
      group_by: ["alertname", "namespace"]
      group_wait: 30s
      group_interval: 5m
      repeat_interval: 4h
      routes:
        - receiver: "null"             # silence the always-firing heartbeat
          matchers: ['alertname = "Watchdog"']
    receivers:
      - name: "null"
      - name: telegram
        telegram_configs:
          - bot_token_file: /etc/alertmanager/secrets/alertmanager-telegram/bot-token
            chat_id: -1001234567890      # integer, NOT quoted
            parse_mode: HTML
            send_resolved: true
            message: |-
              {{ if eq .Status "firing" }}🔴{{ else }}✅{{ end }} {{ .Status | toUpper }} ({{ .Alerts | len }})
              {{ range .Alerts }}
              {{ .Labels.alertname }} [{{ .Labels.severity }}]
              ns: {{ .Labels.namespace }} · {{ .Labels.pod }}{{ .Labels.instance }}
              {{ .Annotations.summary }}{{ .Annotations.description }}
              {{ end }}
The token itself is pulled from Vault:
# ExternalSecret — bot token lands in the "alertmanager-telegram" secret
apiVersion: external-secrets.io/v1
kind: ExternalSecret
metadata:
  name: alertmanager-telegram
  namespace: monitoring
spec:
  refreshInterval: 1h
  secretStoreRef:
    kind: ClusterSecretStore
    name: vault
  target:
    name: alertmanager-telegram
    creationPolicy: Owner
  data:
    - secretKey: bot-token
      remoteRef:
        key: secret/infrastructure/alertmanager
        property: bot-token
2. Detection rules (PrometheusRule)
kube-prometheus-stack ships a solid set of default Kubernetes alerts; on top of those, a custom PrometheusRule covers the security-specific signals — Trivy findings, certificate expiry, Traefik error/brute-force spikes, and Falco runtime events.
# infrastructure/monitoring/alert-rules.yaml
apiVersion: monitoring.coreos.com/v1
kind: PrometheusRule
metadata:
  name: soc-custom-rules
  namespace: monitoring
  labels:
    release: kube-prometheus-stack     # so Prometheus selects it
spec:
  groups:
    - name: trivy.rules
      rules:
        - alert: TrivyCriticalVulnerabilities
          expr: sum(trivy_image_vulnerabilities{severity="Critical"}) > 0
          for: 15m
          labels: { severity: warning }
          annotations:
            summary: "Critical CVEs present in running images"
        - alert: TrivyExposedSecrets
          expr: sum(trivy_image_exposedsecrets{severity=~"Critical|High"}) > 0
          for: 15m
          labels: { severity: critical }
          annotations:
            summary: "Exposed secrets found in container images"
    - name: cert-manager.rules
      rules:
        - alert: CertManagerCertExpiringSoon
          expr: certmanager_certificate_expiration_timestamp_seconds - time() < 7 * 24 * 3600
          for: 1h
          labels: { severity: warning }
          annotations:
            summary: "TLS certificate expiring in <7d"
    - name: traefik.rules
      rules:
        - alert: TraefikHighAuth4xxRate
          expr: |
            sum by (entrypoint) (rate(traefik_entrypoint_requests_total{code=~"401|403"}[5m])) > 5
          for: 10m
          labels: { severity: warning }
          annotations:
            summary: "Auth failure spike — possible brute-force"
    - name: falco.rules
      rules:
        - alert: FalcoHighPriorityEvent
          expr: |
            sum by (rule, priority) (
              rate(falcosidekick_falco_events_total{priority=~"Critical|Error|Warning"}[5m])
            ) > 0
          for: 0m
          labels: { severity: critical }
          annotations:
            summary: "Falco: {{ $labels.rule }} ({{ $labels.priority }})"
3. Image scanning: Trivy Operator
Trivy Operator continuously scans every running image for vulnerabilities, misconfigurations and exposed secrets, and writes the results as CRDs. Two things matter for a smooth run: expose its metrics to Prometheus via a ServiceMonitor, and give the scan jobs enough memory to complete (the default limit is too small for the DB load + scan). Keeping scanJobsConcurrentLimit: 1 means one scan at a time.
# apps/trivy/helm-release.yaml (trivy-operator values)
operator:
  scanJobsConcurrentLimit: 1
  metricsVulnIdEnabled: true          # per-CVE metric for the drill-down table
  scannerReportTTL: "168h"            # rescan unchanged images weekly
trivy:
  resources:
    requests: { cpu: 100m, memory: 128Mi }
    limits:   { cpu: 500m, memory: 1Gi }   # enough to finish a scan cleanly
serviceMonitor:
  enabled: true                       # metrics -> Prometheus
Useful metrics this exposes: trivy_image_vulnerabilities{severity="Critical"}, trivy_image_exposedsecrets, trivy_resource_configaudits, and — with metricsVulnIdEnabled — trivy_vulnerability_id, which carries per-CVE labels (vuln_id, vuln_score, installed_version, fixed_version, image_repository). That last one powers the CVE drill-down in the dashboard.
4. Runtime detection: Falco
Falco is the "someone is inside a container right now" layer. It loads an eBPF probe and watches syscalls — shells spawned in pods, sensitive-file reads, unexpected outbound connections, privilege escalation. Events go to stdout (tailed into Loki by Alloy) and to falcosidekick, which fans out to Loki and exposes Prometheus metrics that feed the FalcoHighPriorityEvent alert.
# infrastructure/falco/helm-release.yaml
driver:
  kind: modern_ebpf          # CO-RE eBPF, no kernel headers needed
controller:
  kind: daemonset
falco:
  json_output: true
  json_include_output_property: true
  priority: notice
# Rule overrides — mute high-volume false positives so the signal stays clean
customRules:
  overrides.yaml: |-
    - rule: Contact K8S API Server From Container
      enabled: false          # fires on every scrape/sidecar/init — noise
    - rule: Drop and execute new binary in container
      enabled: false          # false-positive from CI runners / IaC tooling
falcoctl:
  artifact:
    install: { enabled: true }
    follow:  { enabled: true }
falcosidekick:
  enabled: true
  config:
    loki:
      hostport: http://loki.monitoring.svc.cluster.local:3100
      minimumpriority: notice
  serviceMonitor:
    enabled: true
Only Warning/Error/Critical events page Telegram; Notice/Informational stay in Loki for searching. Tuning noisy rules (above) is what keeps the alerting trustworthy.
5. Turning the edge into a log source (Traefik)
Traefik's access logs are the record of who hit what. Switch them to JSON, keep the headers a SOC cares about, and let Alloy parse status/method into low-cardinality labels.
# infrastructure/traefik/helm-release.yaml
logs:
  general: { level: INFO, format: json }
  access:
    enabled: true
    format: json
    fields:
      defaultMode: keep
      headers:
        defaultMode: drop
        names:
          User-Agent: keep
          X-Forwarded-For: keep
          Cf-Connecting-Ip: keep      # real client IP behind Cloudflare
Alloy tails all pod logs and adds a processing stage that extracts Traefik fields:
// infrastructure/monitoring/alloy.yaml (config snippet)
loki.process "enrich" {
  forward_to = [loki.write.default.receiver]
  stage.match {
    selector = "{namespace=\"kube-system\", pod=~\"traefik.*\"}"
    stage.json {
      expressions = { status = "DownstreamStatus", method = "RequestMethod" }
    }
    stage.labels { values = { status = "", method = "" } }
  }
}
Real client IPs behind Cloudflare
With a Cloudflare Tunnel, requests arrive from cloudflared and the true client IP lives in the Cf-Connecting-Ip header — not ClientHost. Because that header is kept in the access log, LogQL can group auth failures by the real external IP:
topk(15, sum by (request_Cf_Connecting_Ip) (
  count_over_time({namespace="kube-system", pod=~"traefik.*"}
    | json | DownstreamStatus=~"401|403" | request_Cf_Connecting_Ip != `` [$__range])
))
6. Isolation: NetworkPolicies on the crown jewels
A flat pod network means one compromised app can reach everything. The highest-value, lowest-risk first step is a default-deny ingress policy on the sensitive namespaces — the database and Vault — allow-listing only their real clients. Egress is left open so nothing breaks.
# infrastructure/security/netpol/vault.yaml
apiVersion: networking.k8s.io/v1
kind: NetworkPolicy
metadata: { name: default-deny-ingress, namespace: vault }
spec:
  podSelector: {}
  policyTypes: [Ingress]
---
apiVersion: networking.k8s.io/v1
kind: NetworkPolicy
metadata: { name: allow-vault-clients, namespace: vault }
spec:
  podSelector: {}
  policyTypes: [Ingress]
  ingress:
    - from:
        - namespaceSelector:
            matchExpressions:
              - key: kubernetes.io/metadata.name
                operator: In
                values: [external-secrets, monitoring, vault, kube-system]
      ports:
        - { protocol: TCP, port: 8200 }
Note kube-system in the allow-list — that is where Traefik lives, so the Vault UI stays reachable through the ingress. The same default-deny pattern applies per-app as a zero-trust rollout, one namespace at a time.
7. The SOC Overview dashboard
All of the above lands in a single Grafana dashboard — one pane that answers "is anything wrong, and is someone doing something?"
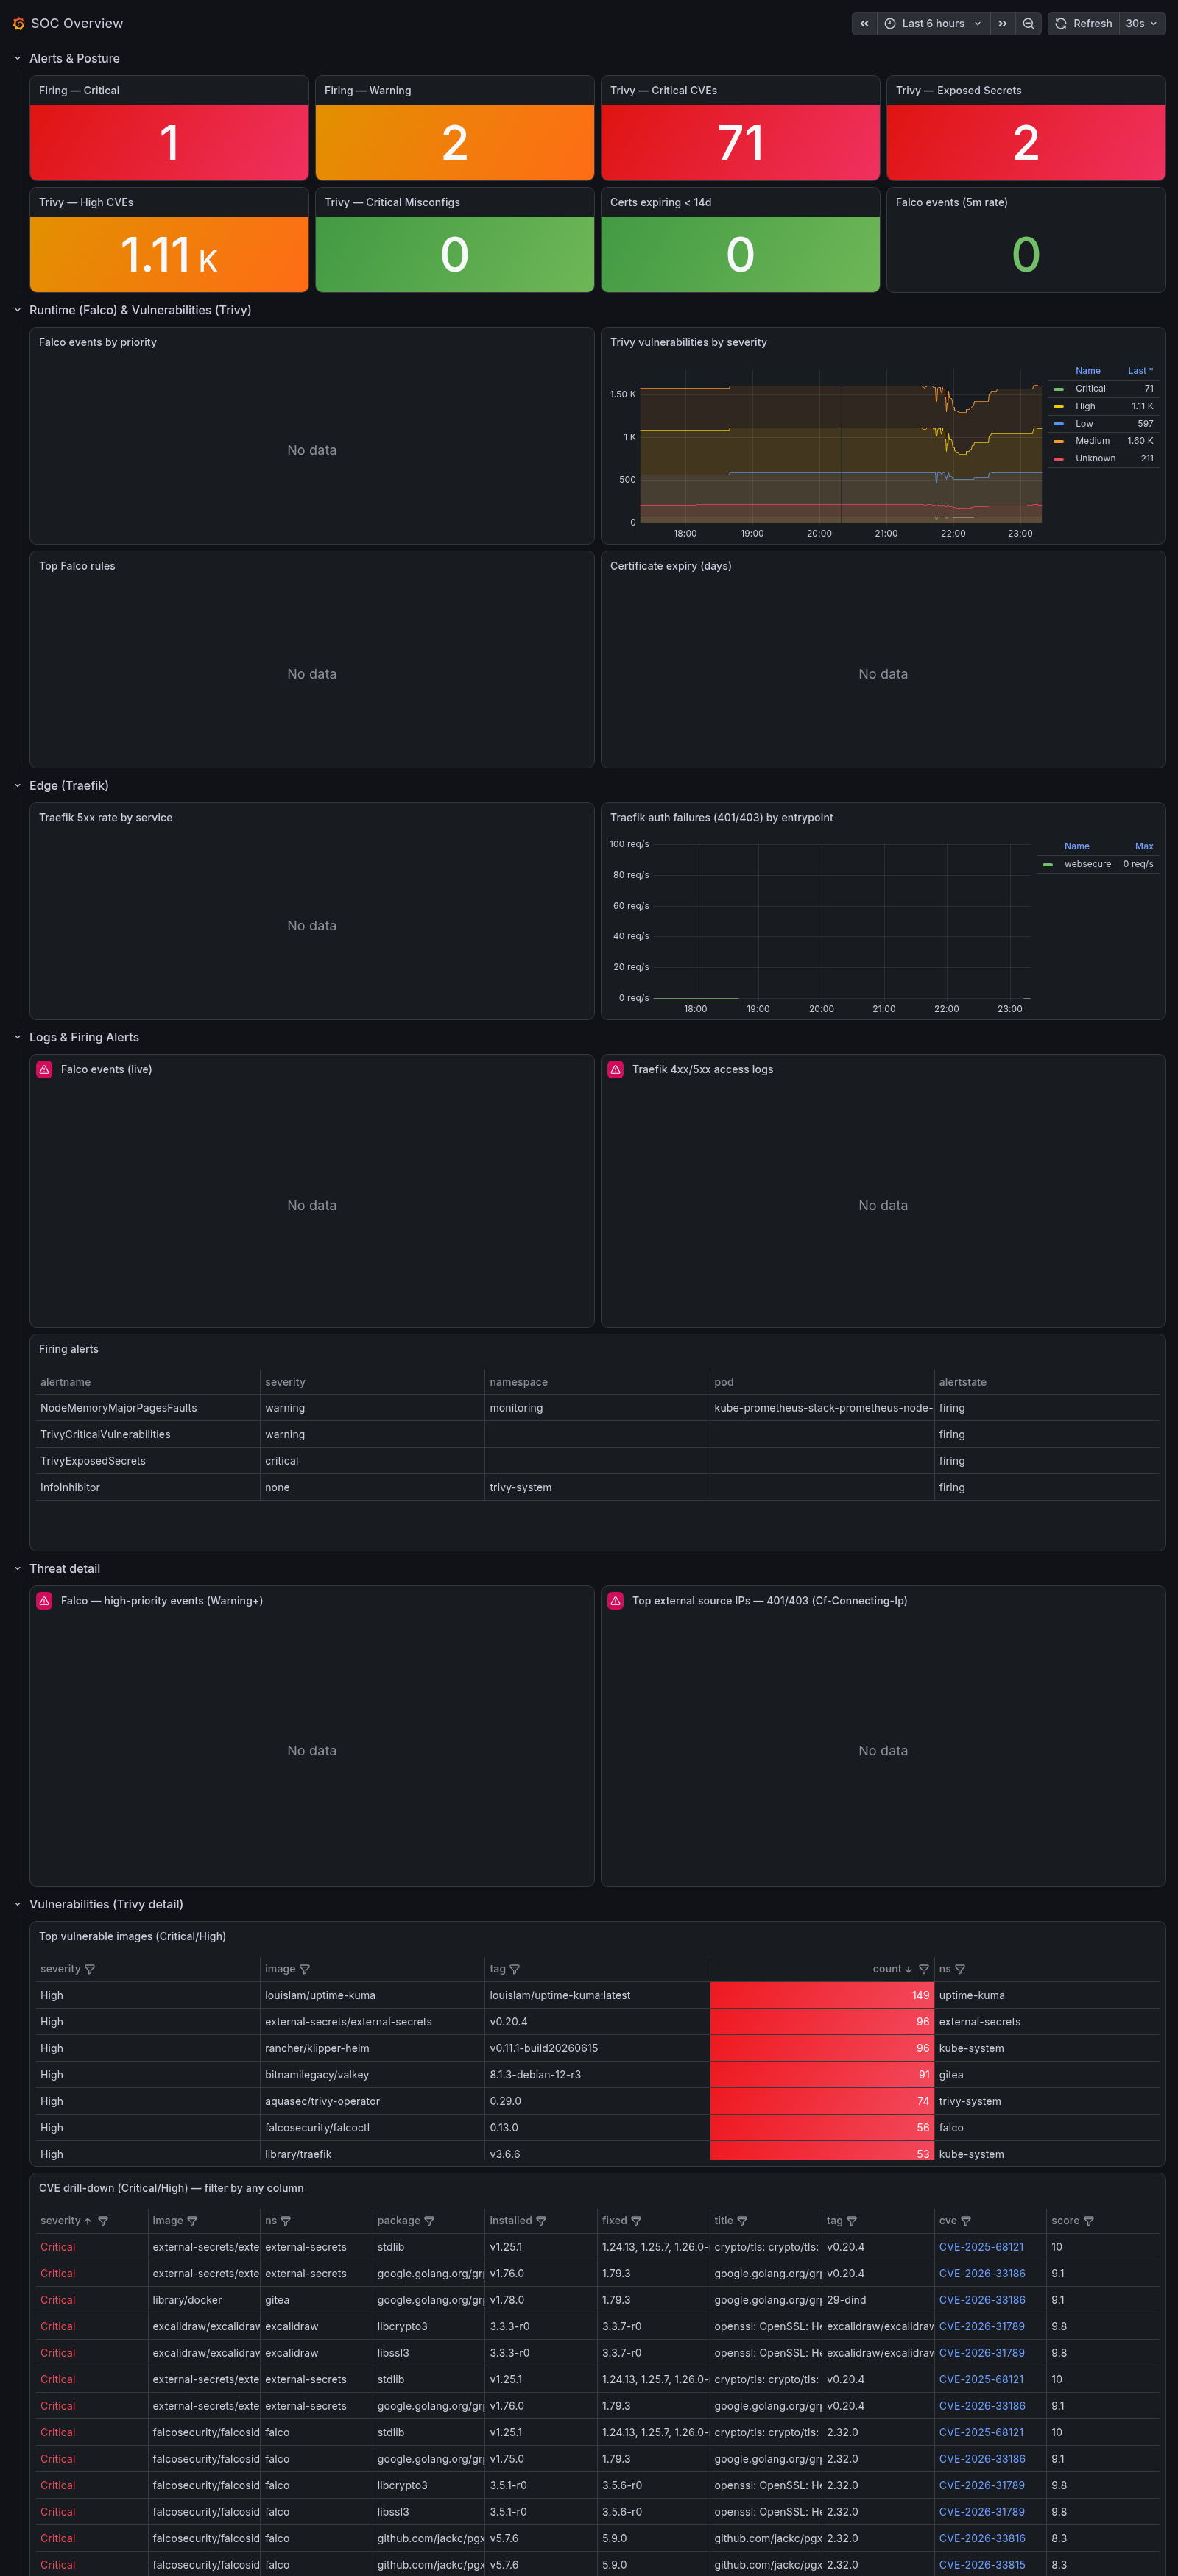
How to read it, top to bottom:
- Alerts & Posture — stat tiles: firing Critical/Warning alerts, Trivy Critical/High CVEs, exposed secrets, critical misconfigs, certs expiring <14d, and the Falco event rate. Green means calm; a red tile is your cue to look down the page.
- Runtime (Falco) & Vulnerabilities (Trivy) — Falco events by priority over time, a "top Falco rules" table, and Trivy vulnerabilities trended by severity. Notice-level Falco events are background noise; a spike in Warning+ is the real signal.
- Edge (Traefik) — 5xx rate per service (app health) and 401/403 rate per entrypoint (brute-force signal).
- Threat detail — a Loki log panel filtered to Falco Warning+ events, and a table of top external source IPs by 401/403 (using
Cf-Connecting-Ip). - Vulnerabilities (Trivy detail) — a "top vulnerable images" table for patch prioritisation, and a fully filterable CVE drill-down (CVE ID, score, image, package, installed → fixed version) where each CVE links out to NVD.
The dashboard is provisioned as a ConfigMap picked up by the Grafana sidecar — Loki-backed panels reference the datasource through a ${loki} template variable rather than a hard-coded UID, which keeps provisioning stable across restarts.
Result
The mental model that ties it together:
- Stat tiles — is anything wrong right now?
- Falco graph + logs — is someone doing something?
- Trivy — how exposed am I?
- Traefik — who's knocking?
Detection (Falco + Trivy) → alerting (Telegram) → a single dashboard → isolation (NetworkPolicies), all reconciled from Git. A real SOC pattern, sized for a homelab, and fully reproducible.