Self-Hosting Kubernetes Monitoring: Why I Killed Datadog
I ran Datadog on my single-node k3s cluster for three months. It worked, it was pretty, and it shipped every log line of my homelab to a US datacenter while eating a couple hundred MB of RAM for the privilege. Meanwhile I had a Grafana instance sitting right there, half-configured, that I never really learned to use.
So I rebuilt the whole observability stack self-hosted, as a learning project with a strict scope:
- Basic cluster resources — CPU, RAM, disk, network per node and per pod
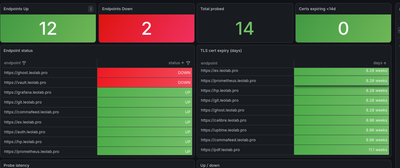
- Traefik status codes per service — so "which app is throwing 5xx" is one query
- MetalLB visibility — pool usage, announcement state
- All container logs into Loki — replacing Datadog's log collection entirely
- Everything GitOps — every dashboard, every scrape target, every retention setting lives in the repo and reconciles through Flux
The end state
Six commits later the stack looks like this:
- kube-prometheus-stack — Prometheus Operator, node-exporter, kube-state-metrics, Grafana (backed by MariaDB so dashboards survive anything), ~25 built-in dashboards
- Traefik with Prometheus metrics enabled and a ServiceMonitor
- MetalLB scraped via PodMonitor
- Loki in SingleBinary mode on a 6Gi PVC with 14-day retention
- Grafana Alloy DaemonSet tailing every pod's logs through the kubelet API
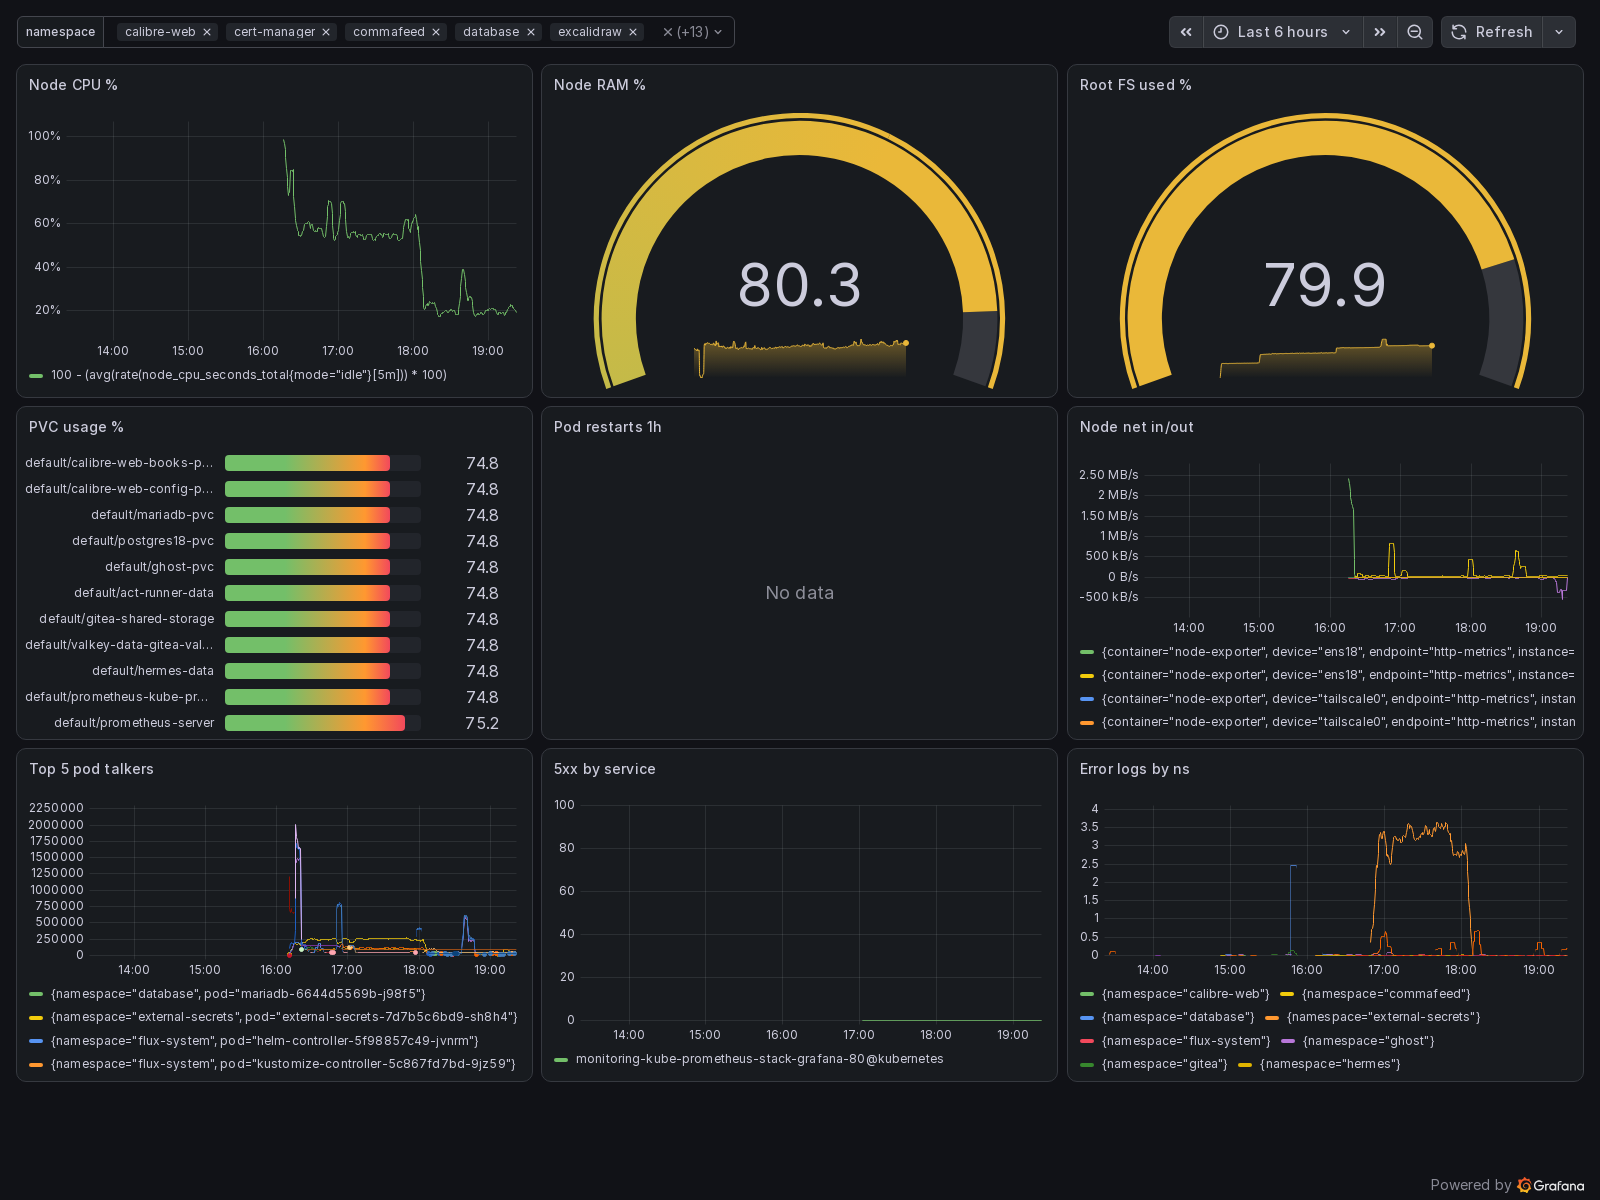
- Dashboards as code — community dashboards pinned by ID and revision in Helm values, my custom overview dashboard exported to a ConfigMap
Datadog: uninstalled, CRDs deleted, API key revoked.
The constraint that shaped everything
My node has a 74G disk with about 17G free when I started. That single fact drove more design decisions than any best-practices doc: Prometheus got an 8Gi PVC with a hard retentionSize: 7GiB cap, Loki got 6Gi, and both keep roughly two weeks of history. Monitoring that fills the disk it's supposed to watch is a self-own — size your retention to your worst week, not your ambitions.
The series
- Part 1 — Migrating from standalone charts to kube-prometheus-stack (and the two collisions that bit me)
- Part 2 — Traefik status codes per service, and the
honorLabelslesson - Part 3 — MetalLB doesn't move your packets: where network metrics actually live
- Part 4 — Loki + Alloy: every log line for a 6GiB budget
- Part 5 — Dashboards as code, and the ghost-series mystery
Each part maps to one Git commit and ends with the PromQL or LogQL I actually learned in that phase. If you just want the manifests, every part has them inline — the whole thing is reproducible on any k3s cluster with Flux.