From Uptime-Kuma to Prometheus Blackbox: GitOps Endpoint Monitoring
Uptime-Kuma is a lovely little status monitor — but every monitor is added by hand in its UI, and that state lives in a database, not in Git. On a GitOps homelab that's the odd one out. So I replaced it with the Prometheus-native stack I already run: blackbox-exporter for probing, a Grafana dashboard for viewing, and Alertmanager → Telegram for paging. Every endpoint, declared in Git, with TLS-expiry monitoring thrown in for free.
Why move off Uptime-Kuma
- Declarative — endpoints live in a
ProbeCRD in Git, not clicked into a UI. New service? Add a line, Flux reconciles. - One stack — reuses the Prometheus/Grafana/Alertmanager I already have. No separate app, DB, or PVC to back up.
- Free extras — blackbox exposes TLS cert expiry and exact HTTP status per probe; alerts route through the same Telegram pipeline as everything else.
(Uptime-Kuma still wins if you want a public status page — that's a different job.)
1. Deploy blackbox-exporter
Tiny (10m CPU / 24Mi). The key is a probe module that treats a homelab's real responses as "up" — including SSO-gated apps that answer 302/401:
# HelmRelease values (prometheus-community/prometheus-blackbox-exporter)
config:
  modules:
    http_probe:
      prober: http
      timeout: 10s
      http:
        # gated (Authelia) endpoints answer 302/401; a vault UI 307->/ui/ is
        # also healthy. Don't follow redirects — judge each endpoint's own code.
        valid_status_codes: [200, 301, 302, 307, 308, 401, 403]
        follow_redirects: false
        preferred_ip_protocol: ip4
2. One Probe CRD for every endpoint
The Prometheus-Operator Probe resource points at blackbox and lists the targets. This is your monitor list — in Git:
apiVersion: monitoring.coreos.com/v1
kind: Probe
metadata:
  name: leolab-endpoints
  namespace: monitoring
  labels: { release: kube-prometheus-stack }
spec:
  interval: 60s
  module: http_probe
  prober:
    url: prometheus-blackbox-exporter.monitoring.svc.cluster.local:9115
  targets:
    staticConfig:
      static:
        - https://leolab.pro
        - https://grafana.leolab.pro
        - https://git.leolab.pro
        - https://vault.leolab.pro
        - https://auth.leolab.pro
        # ...every service
Prometheus then exposes, per target: probe_success, probe_duration_seconds, probe_http_status_code, and probe_ssl_earliest_cert_expiry.
Gotcha: gated endpoints and redirects
Behind an SSO gate (Authelia forward-auth), a probe to a protected app gets a 302 to the login portal — that's the edge working, so it should count as up. And apps like Vault answer 307 → /ui/. With the wrong valid_status_codes these show as false-down. The fix is the status-code list above plus follow_redirects: false so you judge the endpoint's own response, not wherever it redirects.
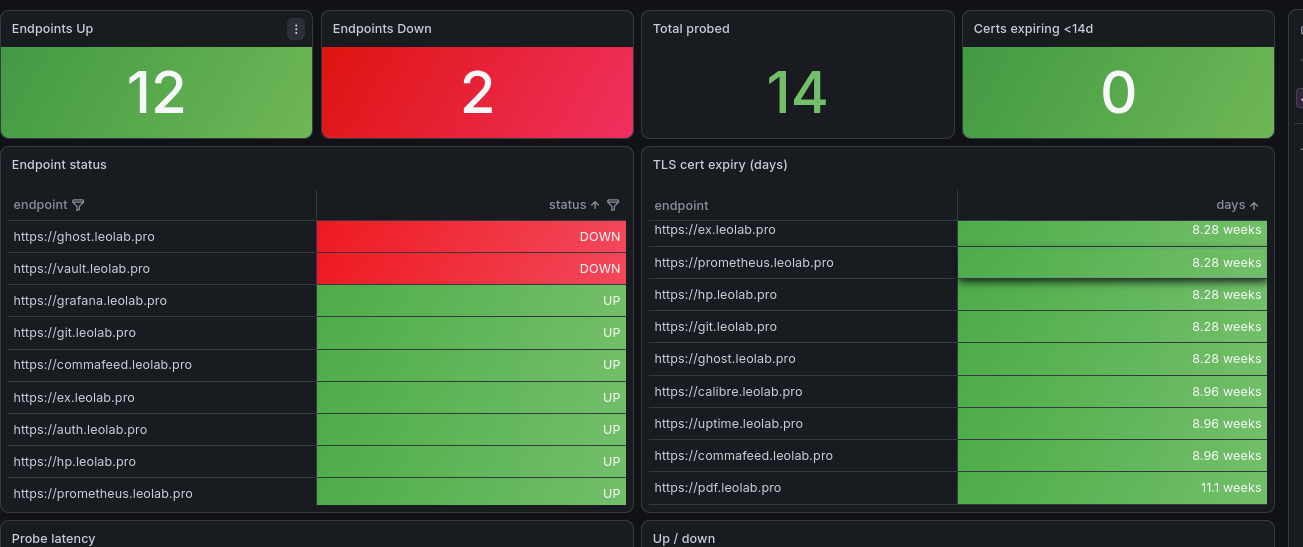
3. The Grafana dashboard
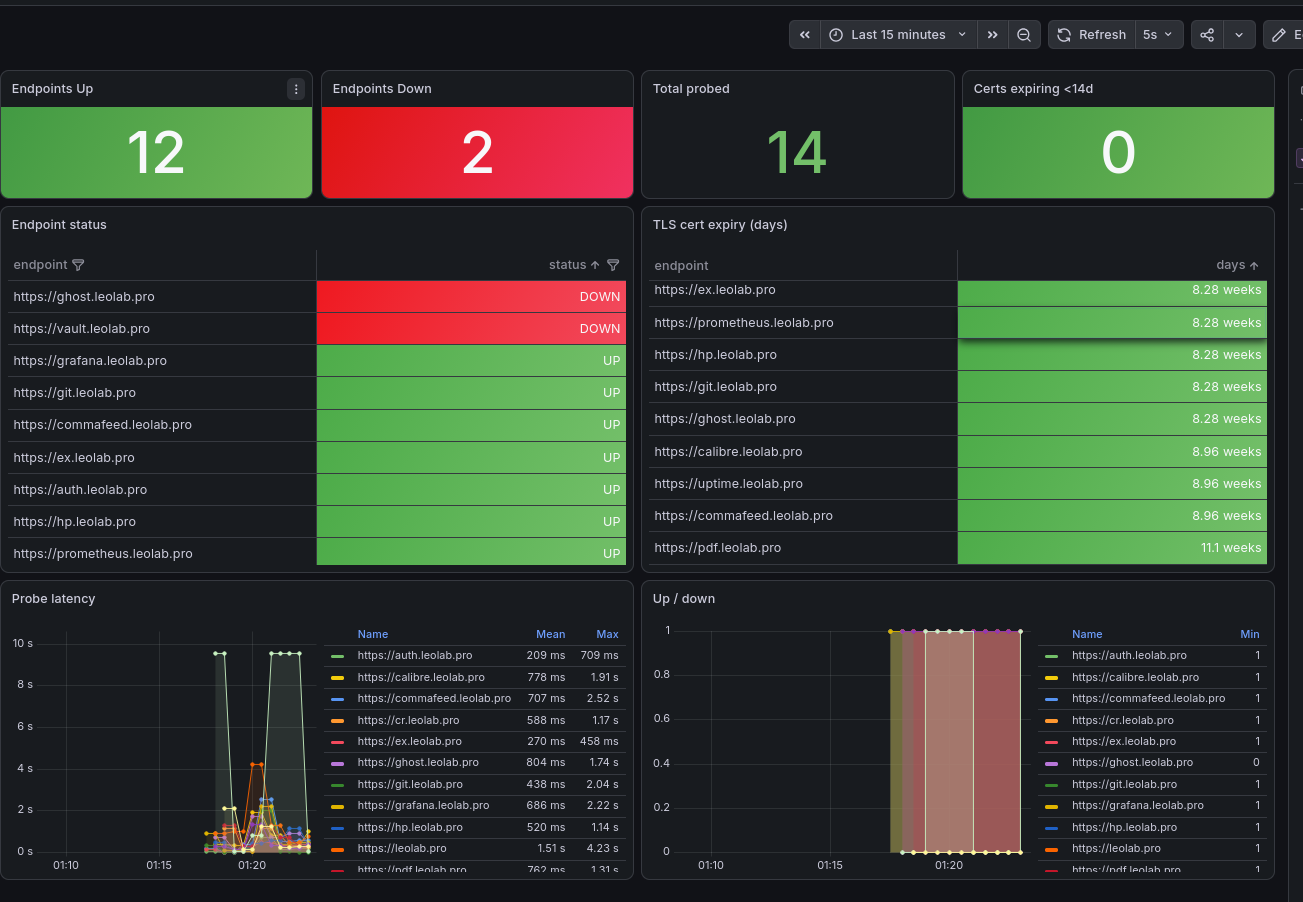
A single "Endpoints" dashboard, provisioned as a ConfigMap:
- Stat tiles — endpoints up / down / total / certs expiring <14d
- Status table —
probe_successper endpoint, value-mapped to UP/DOWN with colour - TLS cert expiry —
(probe_ssl_earliest_cert_expiry - time())/86400, colour-graded by days left - Latency and an up/down timeline
4. Alerts → Telegram
- alert: EndpointDown
  expr: probe_success == 0
  for: 5m
  labels: { severity: critical }
- alert: EndpointCertExpiringSoon
  expr: (probe_ssl_earliest_cert_expiry - time()) / 86400 < 14
  for: 1h
  labels: { severity: warning }
- alert: EndpointSlow
  expr: probe_duration_seconds > 5
  for: 10m
  labels: { severity: warning }
These flow through the same Alertmanager → Telegram route as the rest of the cluster, so a down endpoint or a soon-to-expire cert pings the same channel.
Result
Every service is probed every 60 seconds, up/down + latency + cert-expiry visible on one dashboard, alerts on the same pipeline — and the whole monitor list is a Git file. Adding a new endpoint is one line in the Probe; removing a whole monitoring app (goodbye Uptime-Kuma pod, DB, and PVC) was a few deleted lines that Flux pruned for me.