K8s Monitoring Part 1: Migrating to kube-prometheus-stack

Part 1 of my self-hosted monitoring series. The mission: replace my standalone prometheus and grafana Helm charts with kube-prometheus-stack, the community meta-chart that bundles Prometheus Operator, exporters, Grafana, and a pile of dashboards and alert rules.
Why the operator matters
My old setup used the plain prometheus chart: scrape targets were annotations and static config buried in Helm values. Adding a target meant editing Prometheus's own release. The operator flips that around — you declare a ServiceMonitor or PodMonitor custom resource next to the thing being scraped, and the operator compiles all of them into Prometheus config. Traefik's chart ships one. MetalLB needs four lines of YAML. Prometheus itself never gets touched again.
The one setting that makes this work cluster-wide:
prometheusSpec:
  serviceMonitorSelectorNilUsesHelmValues: false
  podMonitorSelectorNilUsesHelmValues: false
Without it, Prometheus only picks up monitors installed by its own chart. With it, any monitor anywhere in the cluster gets scraped. This is the single most-Googled kube-prometheus-stack setting for a reason.
The HelmRelease
The interesting values (full file in my repo):
values:
  alertmanager:
    enabled: false        # separate project, someday
  kubeControllerManager:
    enabled: false
  kubeScheduler:
    enabled: false
  kubeProxy:
    enabled: false
  kubeEtcd:
    enabled: false
  prometheus:
    prometheusSpec:
      retention: 15d
      retentionSize: 7GiB
      storageSpec:
        volumeClaimTemplate:
          spec:
            storageClassName: local-path
            resources:
              requests:
                storage: 8Gi
  grafana:
    grafana.ini:
      database:
        type: mysql
        host: mariadb.database.svc.cluster.local:3306
    sidecar:
      dashboards:
        enabled: true
Two things worth calling out:
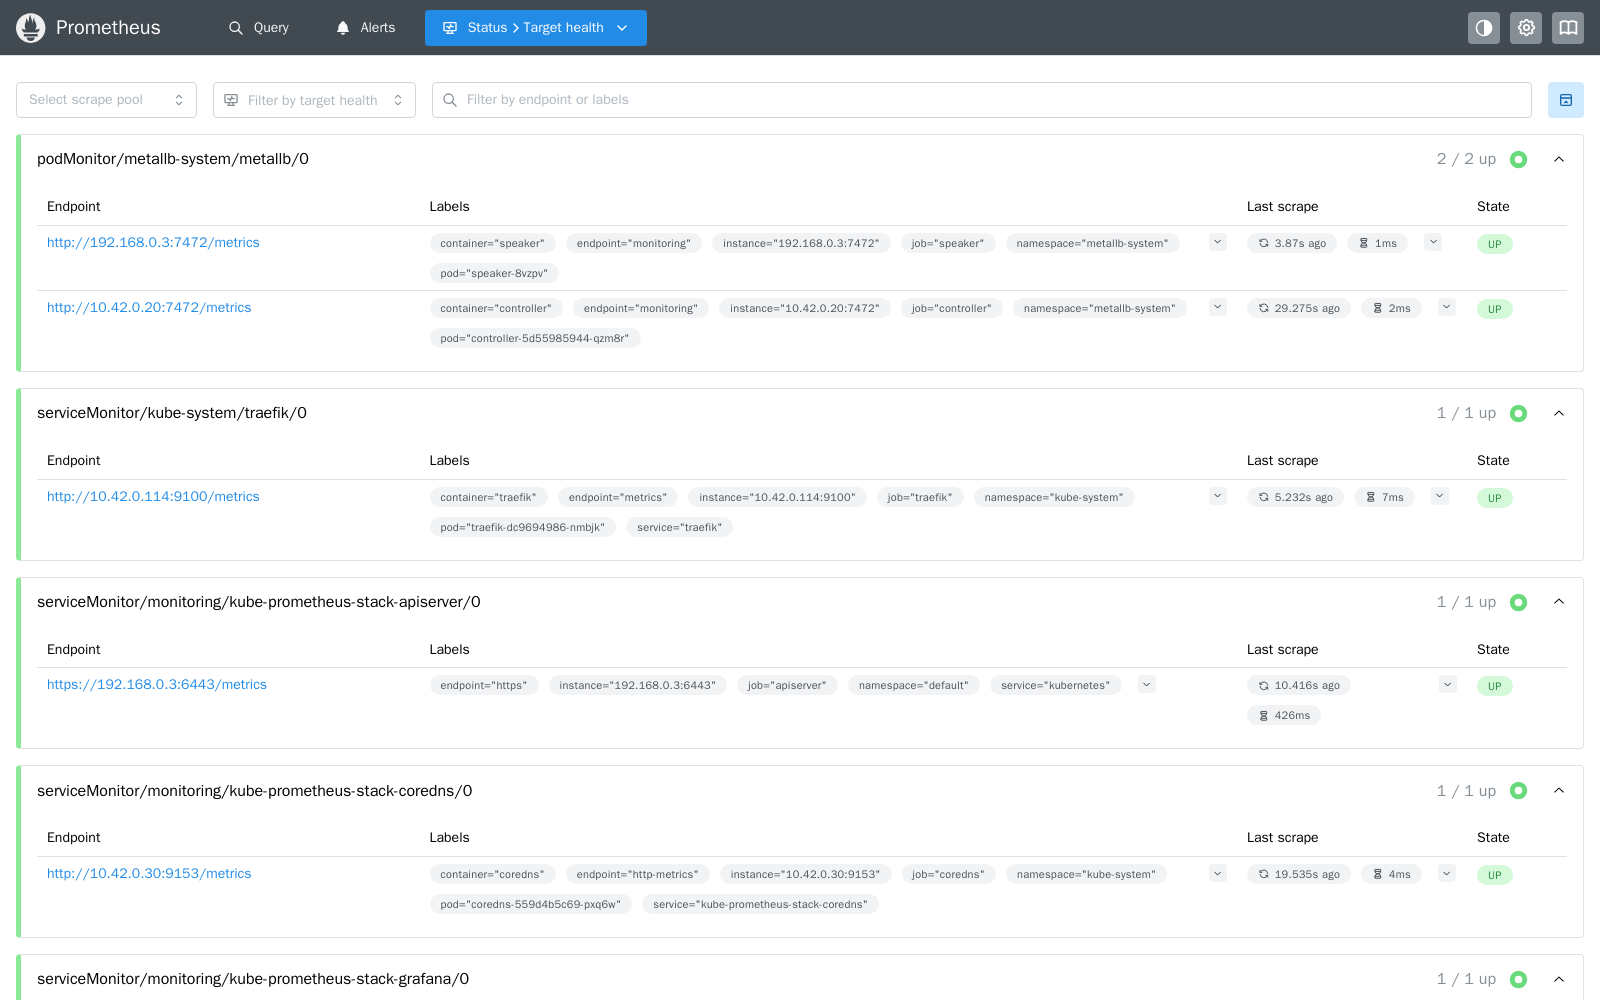
The k3s block. k3s runs the controller-manager, scheduler, kube-proxy and etcd inside one binary. kube-prometheus-stack's default scrape targets for those components will sit permanently DOWN on your targets page, and their alert rules will fire forever. Disable them and the targets page stays honest.
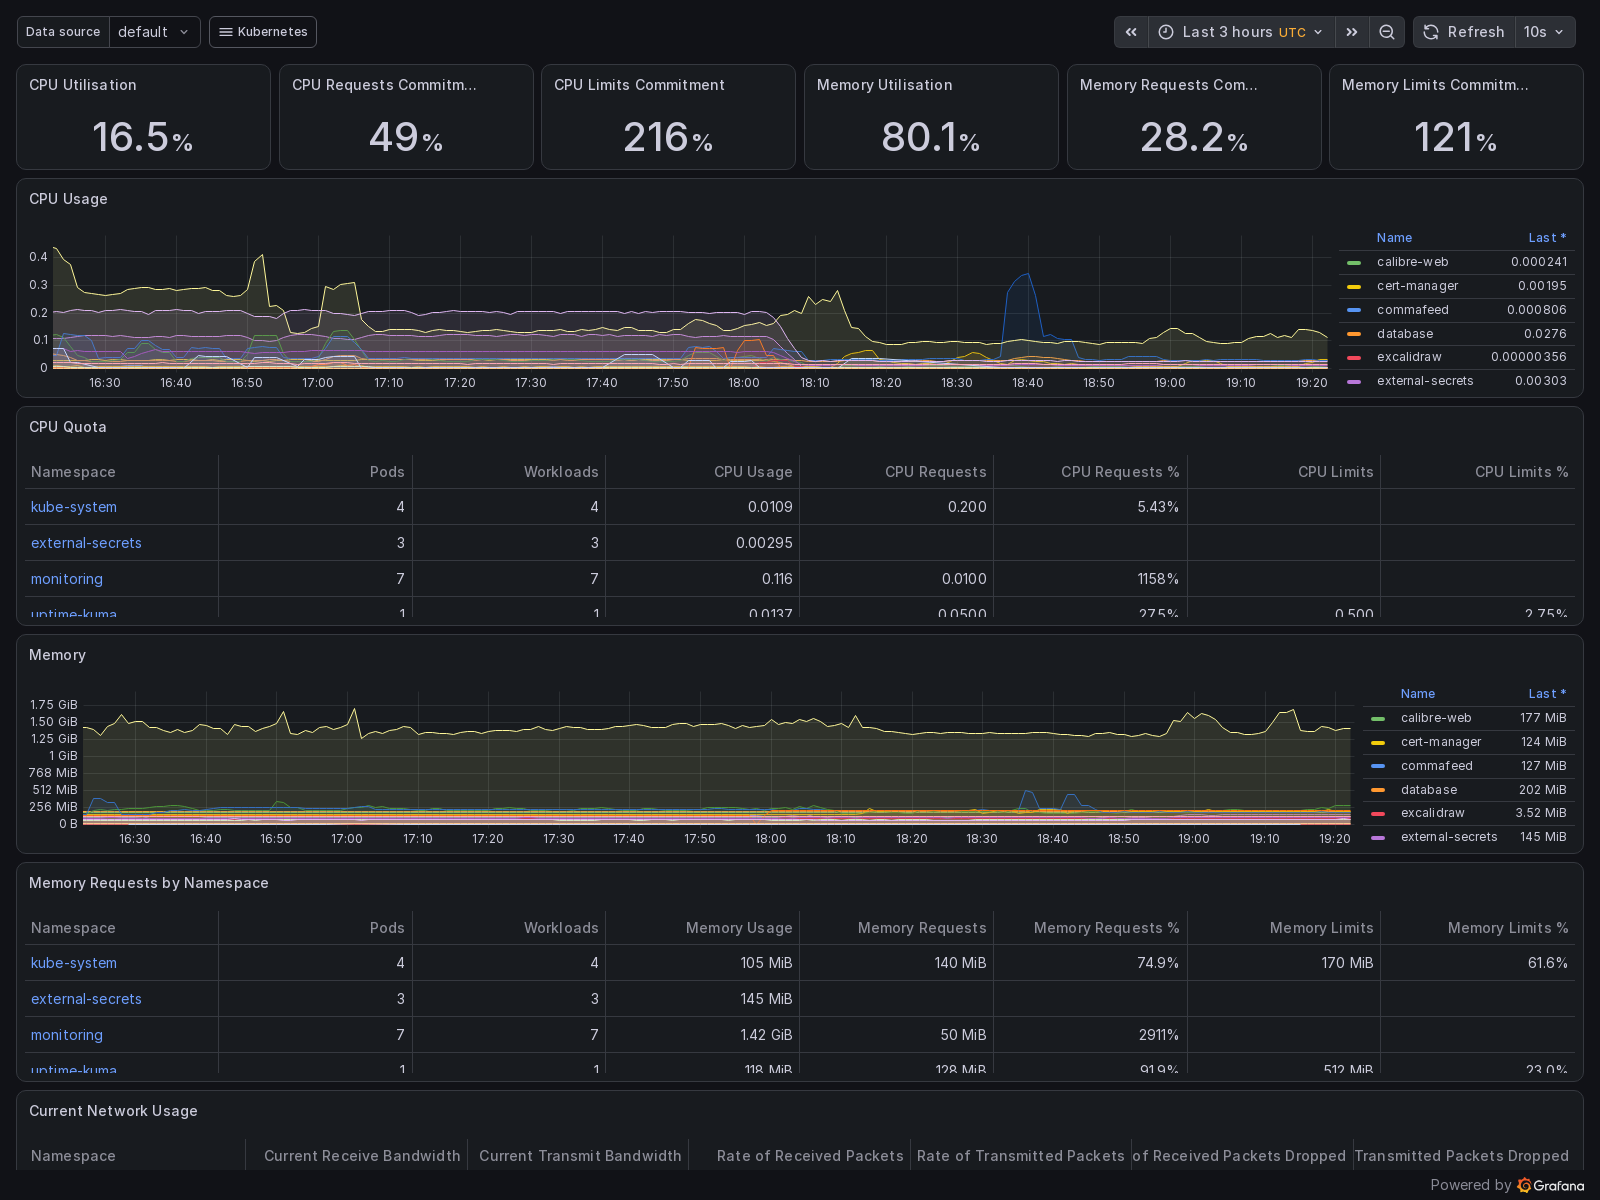
Grafana on MySQL. My Grafana stores its state in MariaDB instead of a local SQLite file. This is what made the migration boring — I deleted the entire old Grafana deployment and the new one came up with every dashboard, user, and setting intact. If you run Grafana on SQLite with an emptyDir, a chart migration means starting over.
Collision #1: hostPort 9100
First install attempt: the new node-exporter pod sat in Pending with
0/1 nodes are available: 1 node(s) didn't have free ports for the requested pod ports.node-exporter binds hostPort 9100, and the old chart's node-exporter was still holding it. On a multi-node cluster you might never notice this race; on a single node it's a guaranteed deadlock — the new stack can't finish installing while the old one lives. Deleting the old HelmRelease freed the port and the install proceeded.
Collision #2: the datasource name
Nastier one. The new Grafana crashlooped with:
Datasource provisioning error: data source not foundCause: kube-prometheus-stack provisions a datasource named Prometheus. My database already had a hand-created datasource named prometheus — and MySQL's default collation is case-insensitive, so the unique constraint saw them as the same name and provisioning blew up. Sharing one database between the old and new Grafana is what saved my dashboards, but it's also what carried the conflict over.
The fix that preserves history: rename the old datasource instead of deleting it. Old dashboards reference the datasource by uid, and the uid survives a rename:
UPDATE data_source SET name='prometheus-old', is_default=0 WHERE id=1;One pod restart later, Grafana came up clean with both datasources — the provisioned one for new work, the renamed one keeping every old panel alive.
Flux footgun: prune: false
My Flux Kustomization for infrastructure has prune: false. That means removing a HelmRelease from Git does nothing to the cluster — the object stays until you kubectl delete it yourself. Every phase of this migration had a manual deletion step for exactly this reason. If your Kustomization prunes, you get that for free (and a different class of accidents).
What you learn at the end of phase 1
With the stack up, the first PromQL concepts, in the order they clicked for me:
upOne series per scrape target, 1 = healthy. The "is it plugged in" query.
node_memory_MemAvailable_bytesA gauge — read it directly, it goes up and down.
100 - (avg(rate(node_cpu_seconds_total{mode="idle"}[5m])) * 100)A counter only ever increases, so its raw value is useless — you always wrap it in rate() to get per-second change. CPU busy % is just idle-rate inverted.
sum by (namespace) (container_memory_working_set_bytes{container!=""})sum by is GROUP BY. This one instantly told me which namespace eats my RAM (it was Gitea. It's always Gitea).
Next up, part 2: turning on Traefik's metrics and finding out which of my apps actually error.