K8s Monitoring Part 2: Traefik Status Codes per Service
Part 2. Goal: see HTTP status codes per service, so "something is 500ing" becomes "ghost is 500ing" without opening a single log file.
Turning it on
Traefik's Helm chart ships everything; mine had it explicitly off (metrics.prometheus.enabled: false with a "later if needed" comment — reader, it was needed). The replacement block:
metrics:
  prometheus:
    entryPoint: metrics
    addEntryPointsLabels: true
    addRoutersLabels: true
    addServicesLabels: true
    serviceMonitor:
      enabled: true
      honorLabels: true
The three add*Labels flags are what make per-service breakdowns possible — without them you get totals per entrypoint and nothing else. The ServiceMonitor plugs into the operator from part 1: no Prometheus config touched, target appears on its own.
The honorLabels lesson
That honorLabels: true line wasn't in my first commit, and its absence produced a genuinely confusing bug: every request metric was labeled service="traefik". All of them. The real service names were hiding in a label called exported_service.
What happened: Prometheus attaches target labels to everything it scrapes — and the scrape target is the Kubernetes Service named traefik, so every series gets service="traefik" stamped on it. When the metric already has a label with that name (Traefik's own service label, the one I actually wanted), Prometheus resolves the conflict by renaming the metric's version to exported_service.
honorLabels: true flips the resolution: the exporter's labels win. One line, and service means what Traefik says it means. You will hit this with any exporter that emits labels named service, job, instance, or namespace — now you know the shape of it.
The queries
Service label values look like ghost-ghost-80@kubernetes — namespace, service, port. Build these up in Grafana Explore:
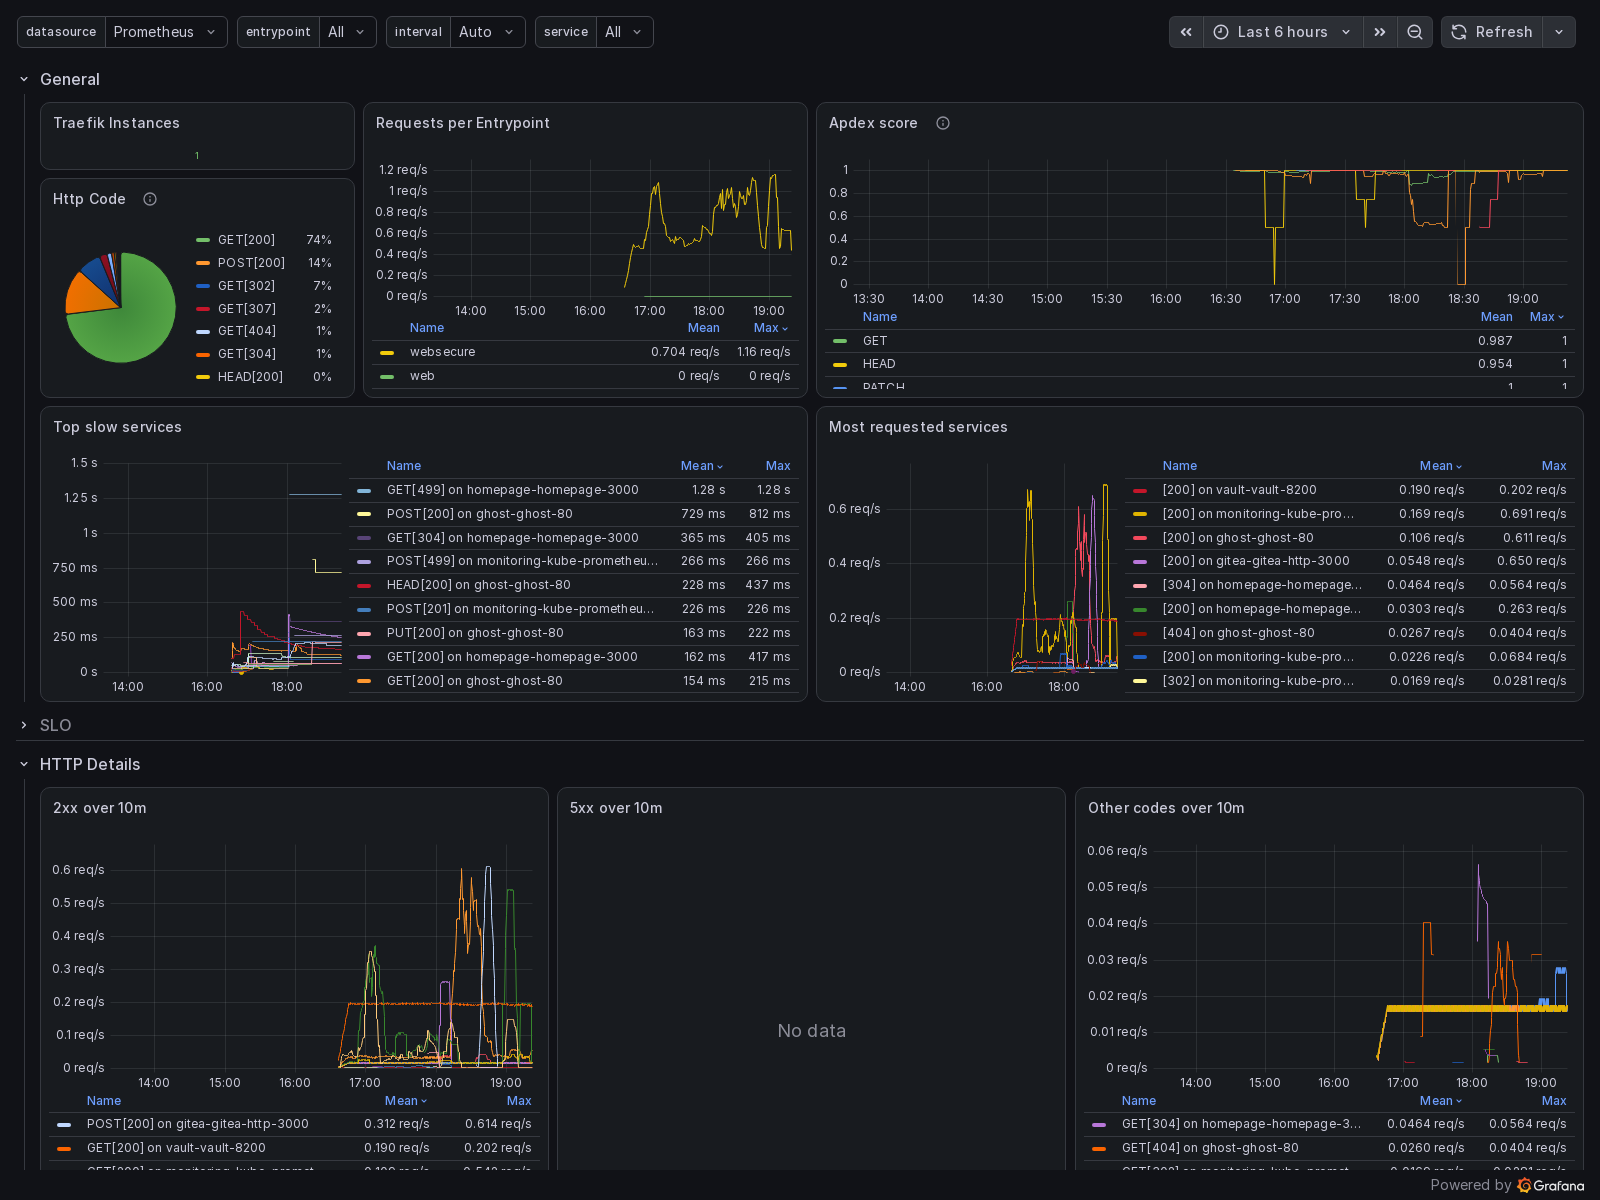
sum by (service) (rate(traefik_service_requests_total[5m]))Requests per second per app. Counter → rate() → aggregate, always in that order.
sum by (service) (rate(traefik_service_requests_total{code=~"5.."}[5m]))The "which deployment is broken" query. =~ is regex matching, 5.. is any 5xx code.
100 * sum by (service) (rate(traefik_service_requests_total{code=~"5.."}[5m]))
    / sum by (service) (rate(traefik_service_requests_total[5m]))
Error ratio, which is the honest version — ten errors per second means something completely different at 10 req/s versus 10,000 req/s. Division in PromQL joins the two sides on matching labels, which is why both halves aggregate by (service).
histogram_quantile(0.95,
  sum by (service, le) (rate(traefik_service_request_duration_seconds_bucket[5m])))
p95 latency per service. Prometheus histograms are families of counters with an le ("less than or equal") bucket label; histogram_quantile interpolates a quantile from them. The trap: le must survive your sum by, or the math silently produces garbage.
What it costs
Effectively nothing. Traefik was already routing every request; counting them adds a few MB of memory and one scrape target. The pod restarts once when the flags land — with a single replica that's a sub-second blip on a homelab.
Part 3: MetalLB, and the discovery that my load balancer forwards zero packets.