K8s Monitoring Part 3: MetalLB Doesn't Move Your Packets
Part 3. I wanted "MetalLB network in/out" on a dashboard. What I learned instead is that the question doesn't parse — and the answer to the question I meant lives in two other exporters entirely.
L2 MetalLB forwards nothing
In layer-2 mode, MetalLB's speaker does exactly one thing: when something on the LAN asks "who has 192.168.0.20?", it answers ARP with the node's MAC address. That's it. The actual packets flow to the node and kube-proxy routes them to pods — MetalLB is not in the data path. There is no bandwidth to measure because no bytes pass through it.
So MetalLB's metrics are about allocation and announcement, and they're still worth scraping — an IP pool quietly running out is a real outage-in-waiting.
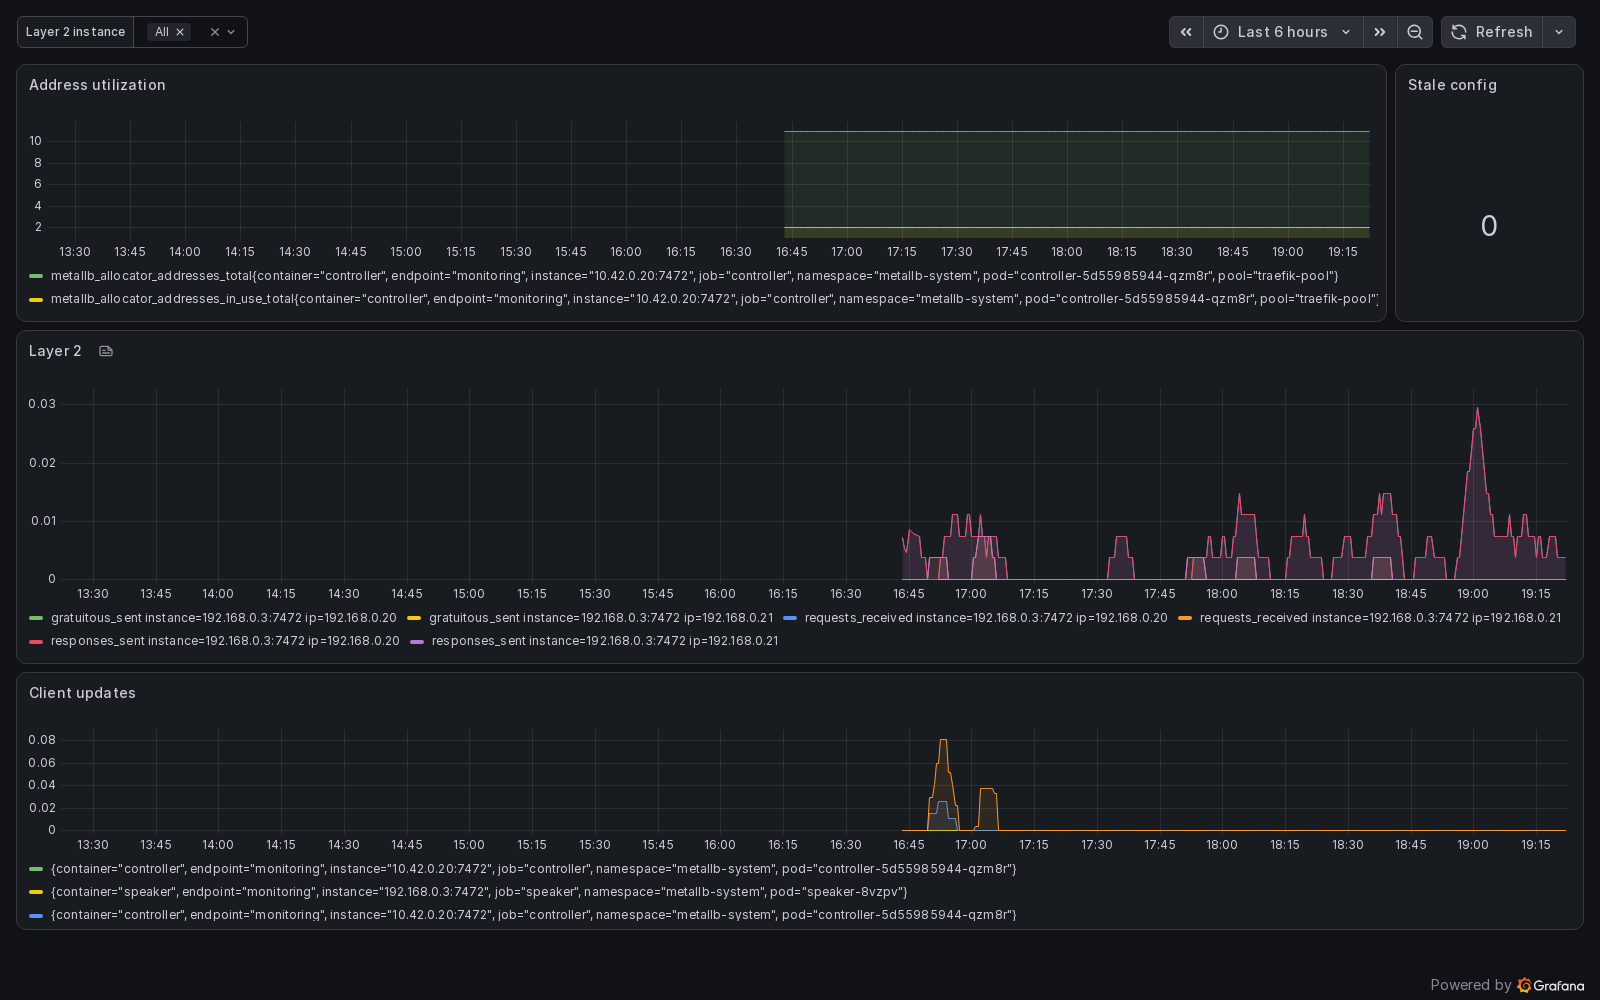
Scraping it: PodMonitor, not ServiceMonitor
MetalLB's native manifests expose metrics on port 7472 but ship no Service for them, so a ServiceMonitor has nothing to select. PodMonitor targets pods directly:
apiVersion: monitoring.coreos.com/v1
kind: PodMonitor
metadata:
  name: metallb
  namespace: metallb-system
spec:
  jobLabel: component
  selector:
    matchLabels:
      app: metallb
  podMetricsEndpoints:
    - port: monitoring
Both the speaker and controller carry app: metallb and name their metrics port monitoring, so one PodMonitor covers both. Thanks to the nil-selector setting from part 1, Prometheus picked it up without any further wiring.
First useful discovery within a minute of scraping:
metallb_allocator_addresses_in_use_total{pool="traefik-pool"} => 2Two? I only knew about Traefik's IP. Turns out Gitea's SSH service had quietly claimed a second LoadBalancer IP months ago. The metric knew my cluster better than I did.
Where traffic numbers actually live
Since MetalLB can't tell you about bandwidth, three sources that can:
Node NICs (node-exporter) — total in/out for the whole machine:
rate(node_network_receive_bytes_total{device!~"lo|veth.*|cni.*|flannel.*"}[5m])The device regex matters. Kubernetes gives every pod a veth pair on the node, and the CNI adds bridges — count those alongside the physical NIC and you double-count every packet. Exclude loopback, veths, and your CNI's interfaces; what's left is actual wire traffic. Swap receive for transmit for the other direction.
Per-pod (cAdvisor, already scraped via kubelet) — who is doing the talking:
topk(5, sum by (namespace, pod) (rate(container_network_receive_bytes_total[5m])))On my cluster the Traefik pod tops this constantly, which makes sense: every HTTP request to every app passes through it, so its traffic ≈ total ingress volume. topk keeps dashboards readable — nobody needs forty flat lines.
Traefik itself — payload volume per entrypoint: traefik_entrypoint_requests_bytes_total, same rate() treatment.
Disk, while we're here
Same phase, same lesson — the metrics were already flowing, only the queries were missing:
100 * (1 - sum(node_filesystem_avail_bytes{mountpoint="/", fstype!~"tmpfs|overlay"})
          / sum(node_filesystem_size_bytes{mountpoint="/", fstype!~"tmpfs|overlay"}))
Node root filesystem used %. Note the shape: sum the bytes first, divide once. The tempting alternative — summing per-filesystem ratios — breaks the moment the selector matches more than one series (a second node, a stale series in a range query) and hands you a 140% disk. Aggregate raw, divide late.
100 * kubelet_volume_stats_used_bytes / kubelet_volume_stats_capacity_bytes > 80Every PVC over 80% full, straight from kubelet — appending a comparison filters the vector, so this is a ready-made "what needs attention" list.
Part 4: logs. Loki, Alloy, and the deletion of Datadog.