K8s Monitoring Part 5: Dashboards as Code
Final part. Everything is scraped, everything is logged — now it needs to be visible, and it needs to live in Git like everything else.
Community dashboards, pinned like dependencies
Grafana.com hosts thousands of community dashboards, each with an ID and revision history. The Grafana Helm chart can download them at startup, declared in values — which makes a dashboard a pinned dependency, not a thing someone once clicked together:
dashboardProviders:
  dashboardproviders.yaml:
    apiVersion: 1
    providers:
      - name: community
        folder: Community
        type: file
        options:
          path: /var/lib/grafana/dashboards/community
dashboards:
  community:
    node-exporter-full:
      gnetId: 1860
      revision: 45
      datasource: Prometheus
    traefik:
      gnetId: 17347
      revision: 9
      datasource: Prometheus
    loki-logs:
      gnetId: 13639
      revision: 2
      datasource: Loki
    metallb:
      gnetId: 14127
      revision: 1
      datasource: Prometheus
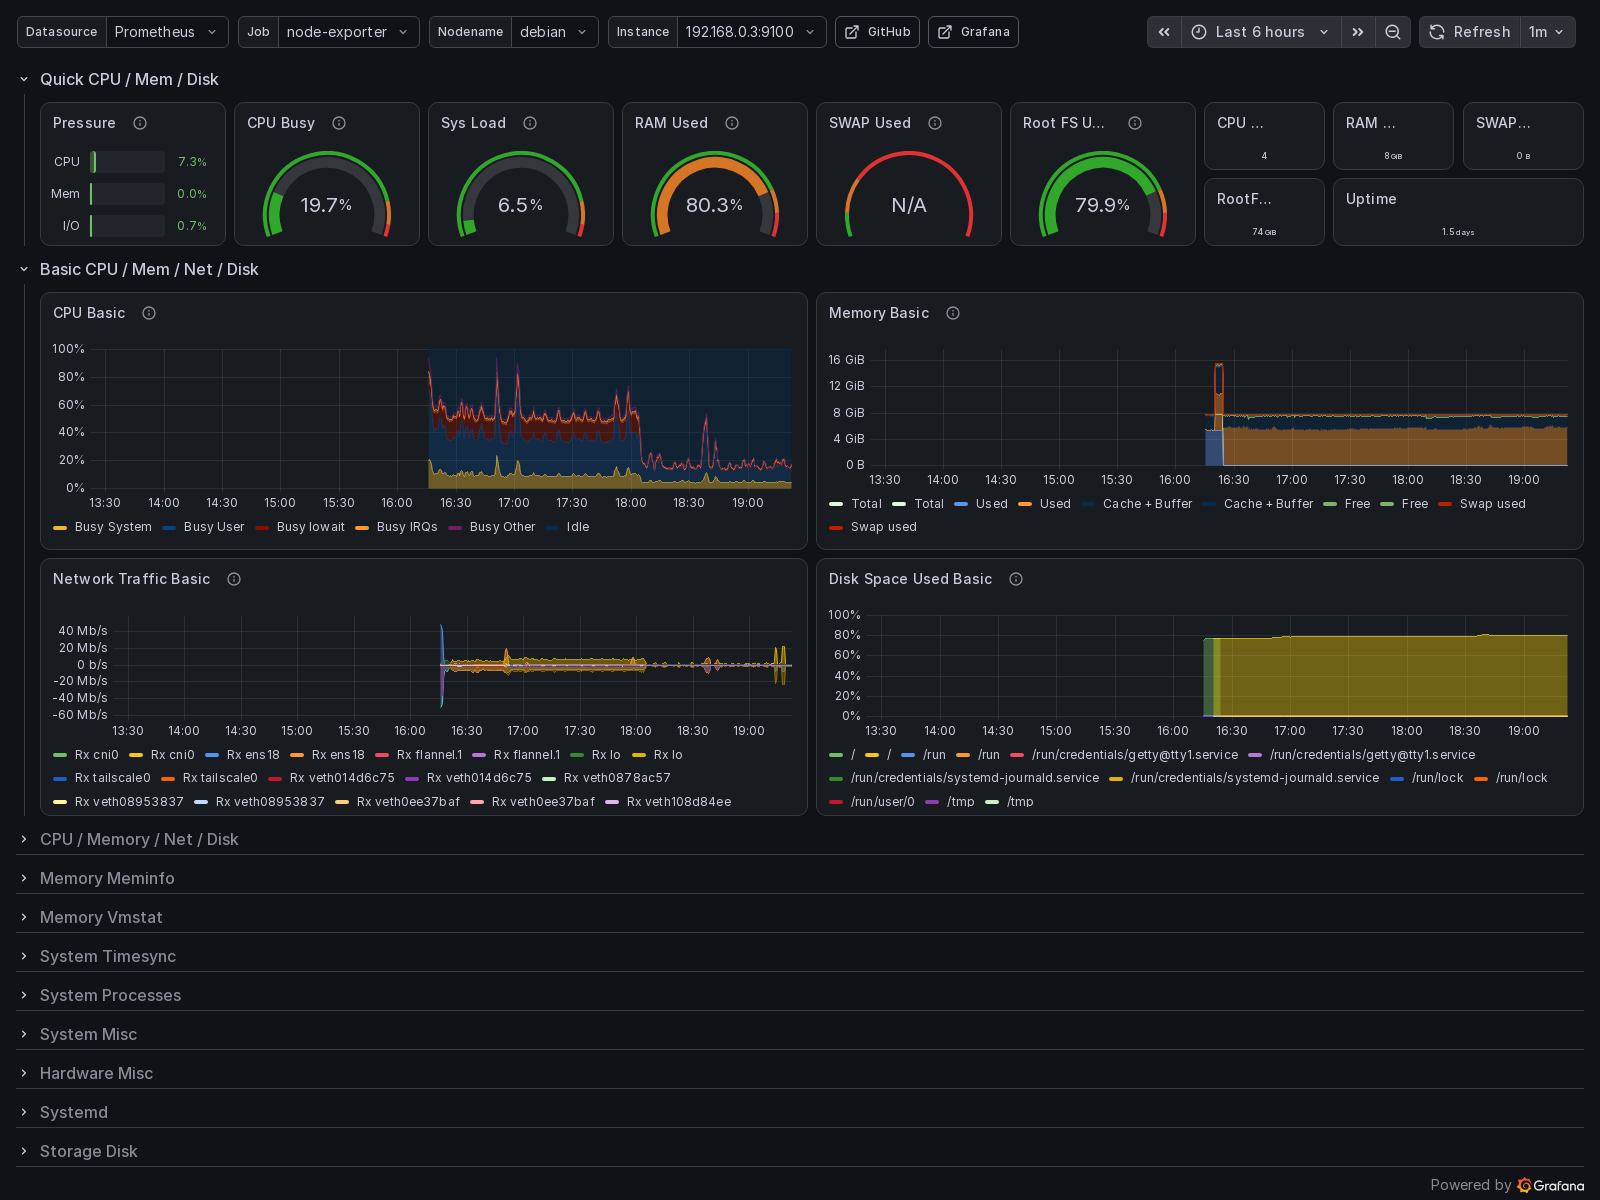
Revisions drift — check grafana.com/api/dashboards/<id> for the latest before pinning. Dashboard 1860 (Node Exporter Full) is the single best argument for this feature: forty-odd panels of node detail you will never build yourself.
Building my own: nine panels
Community dashboards teach you to read; building one teaches you to think. My "Cluster Overview" — each panel is one question I actually ask:
- Node CPU % and RAM % — gauges with thresholds at 70/85
- Root FS used % — the panel that watches my 74G disk
- PVC usage % — bar gauge, legend templated as
{{namespace}}/{{persistentvolumeclaim}} - Pod restarts (1h) — table,
increase(kube_pod_container_status_restarts_total[1h]) > 0 - Node network in/out — two queries in one panel, transmit drawn negative-Y via field override
- Top 5 pod talkers — the
topkquery from part 3 - 5xx by service — the Traefik query from part 2
- Error logs by namespace — the LogQL metric query from part 4, making this a mixed Prometheus + Loki dashboard
Plus one variable: type Query, label_values(kube_pod_info, namespace), multi-value + All, referenced in queries as {namespace=~"$namespace"}. Lesson learned the dumb way: variable names are case-sensitive. I created Namespace, queried $namespace, and stared at "no data" until the Query Inspector showed me the un-substituted string. The inspector shows exactly what Grafana sent — it's the first place to look when a panel is empty.
The ghost series
Mid-build, my RAM gauge showed two gauges: 73.7% and 76%. Same query, one node. The second value came from the old chart's node-exporter — deleted an hour earlier, but my panel's time range was six hours, and a gauge's default calculation ("last non-null") happily renders the final value of a dead series. Prometheus marks a vanished series stale after five minutes, but any range query that spans its lifetime still returns its samples.
Not a bug — a lesson about what time series are. Fixes, pick any: shorten the time range, switch the calculation to strict "Last", or aggregate so pod identity stops mattering. And when a panel shows more series than you expect, hover the legend: target labels (pod, job, instance) tell you exactly who each line is.
Exporting to Git
The Grafana sidecar (from part 1's values) watches for ConfigMaps labeled grafana_dashboard: "1" and loads them, with a folder taken from an annotation. So closing the loop is: pull the JSON from Grafana's API, wrap it in a ConfigMap, commit:
curl -s -u admin:*** \
  https://grafana.example.com/api/dashboards/uid/<uid> \
  | jq '.dashboard | .id = null'
apiVersion: v1
kind: ConfigMap
metadata:
name: dashboard-cluster-overview
namespace: monitoring
labels:
grafana_dashboard: "1"
annotations:
grafana_folder: Custom
data:
cluster-overview.json: |
{ ... exported JSON, indented ... }Neat detail: the provisioned dashboard keeps the same uid as the one I built in the UI, so the sidecar version replaced my draft in place — no duplicate to clean up, and the dashboard flipped to provisioned: true. From here on, editing means: change in UI, re-export, commit. The UI is a scratchpad; Git is the truth.
Series wrap-up
Five phases, six commits, zero SaaS:
- kube-prometheus-stack — operator model, nil selectors, k3s target pruning
- Traefik metrics — status codes per service,
honorLabels - MetalLB — PodMonitor, and learning L2 mode forwards nothing
- Loki + Alloy — all logs, four labels, 6GiB, cardinality discipline
- Dashboards as code — pinned community boards + custom overview in ConfigMaps
The transferable part isn't the YAML — it's the grammar. Counters get rate(), gauges don't. sum by is GROUP BY. Labels are for routing, content is for filtering. Histograms need their le. Aggregate bytes, divide late. Dead series linger as long as your time range remembers them. That grammar is the same on a one-node homelab and a thousand-node fleet — mine just fits on a 74G disk.