K8s Monitoring Part 4: Loki + Alloy — Every Log for 6GiB
Part 4, the one Datadog doesn't survive. Goal: every container log from every namespace, searchable in Grafana, on a 6GiB disk budget.
Why Loki is cheap
Elasticsearch and Datadog index the content of every log line — powerful, and expensive in RAM and storage. Loki indexes only labels (I use four: namespace, pod, container, app) and stores the content as compressed chunks. Searching content is a brute-force grep at query time, scoped by the label index. At homelab scale the grep is instant, and the whole thing runs in one pod.
Loki: SingleBinary mode
The grafana/loki chart defaults to a microservices topology designed for clusters that ingest terabytes. Every one of those knobs turns off:
values:
  deploymentMode: SingleBinary
  loki:
    auth_enabled: false
    commonConfig:
      replication_factor: 1
    storage:
      type: filesystem
    schemaConfig:
      configs:
        - from: "2024-04-01"
          store: tsdb
          object_store: filesystem
          schema: v13
          index:
            prefix: index_
            period: 24h
    limits_config:
      retention_period: 14d
    compactor:
      retention_enabled: true
      delete_request_store: filesystem
  singleBinary:
    replicas: 1
    persistence:
      size: 6Gi
  backend:  { replicas: 0 }
  read:     { replicas: 0 }
  write:    { replicas: 0 }
  gateway:      { enabled: false }
  chunksCache:  { enabled: false }
  resultsCache: { enabled: false }
  lokiCanary:   { enabled: false }
One pod, one 6Gi PVC, filesystem storage, no object store, no memcached, no nginx gateway. The compactor enforces 14-day retention. Grafana talks straight to loki:3100.
Alloy: the collector
Promtail — the classic Loki agent — is deprecated with an EOL in early 2026. Its replacement is Grafana Alloy, configured in a pipeline language where components wire into each other. Mine is four blocks: discover pods → attach labels → tail logs → push to Loki.
discovery.kubernetes "pods" {
  role = "pod"
}

discovery.relabel "pods" {
  targets = discovery.kubernetes.pods.targets
  rule {
    source_labels = ["__meta_kubernetes_namespace"]
    target_label  = "namespace"
  }
  rule {
    source_labels = ["__meta_kubernetes_pod_name"]
    target_label  = "pod"
  }
  rule {
    source_labels = ["__meta_kubernetes_pod_container_name"]
    target_label  = "container"
  }
  rule {
    source_labels = ["__meta_kubernetes_pod_label_app_kubernetes_io_name"]
    regex         = "(.+)"
    target_label  = "app"
  }
}

loki.source.kubernetes "pods" {
  targets    = discovery.relabel.pods.output
  forward_to = [loki.write.default.receiver]
}

loki.write "default" {
  endpoint {
    url = "http://loki.monitoring.svc.cluster.local:3100/loki/api/v1/push"
  }
}
The nice trick: loki.source.kubernetes tails logs through the kubelet API rather than mounting /var/log/pods from the host — no hostPath volumes, no privileged anything. Deployed as a DaemonSet (of one, on my cluster) it replaced Datadog's containerCollectAll completely. All eighteen namespaces were streaming within a minute.
The cardinality rule
The one Loki lesson that matters, so it gets its own heading. Every unique combination of label values creates a stream: its own index entry, its own chunk files. Four labels with bounded values — dozens of namespaces, hundreds of pods — is a healthy few hundred streams. Add one unbounded label (user_id, trace_id, request path) and you create a stream per user, per trace, per URL: millions of streams, and Loki tips over.
The discipline: labels are for routing, content is for filtering. If you'd put it in a WHERE clause on a low-cardinality column, it's a label. Everything else you grep at query time.
LogQL in five queries
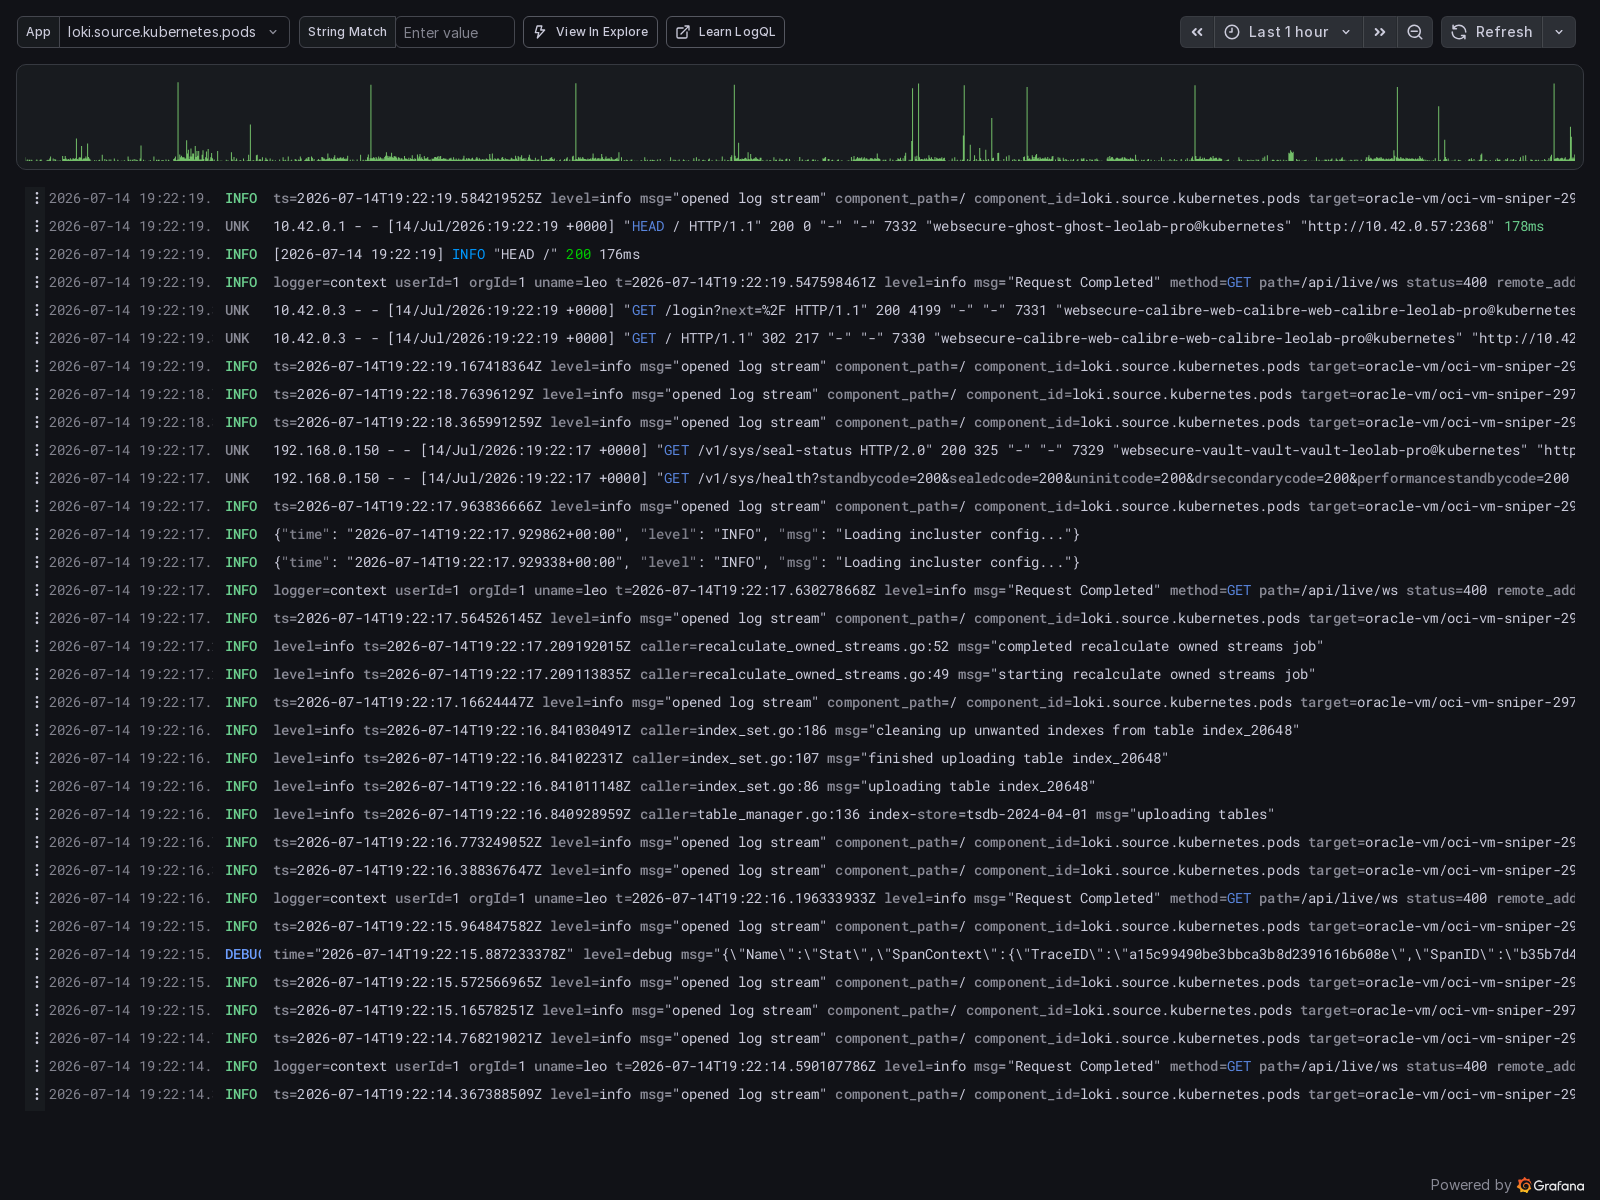
{namespace="gitea"}Stream selector — hits the index, fast.
{namespace="gitea"} |= "error"Line filter — grep after the index narrows. |= contains, != excludes, |~ "(?i)error" is case-insensitive regex.
sum by (namespace) (rate({namespace=~".+"} |~ "(?i)error" [5m]))Metrics from logs: error rate per namespace, no exporter, no instrumentation. Same rate()/sum by grammar as PromQL — the skills transfer 1:1.
{app="traefik"} | json | status >= 400Parser stage: extract fields from structured logs, then filter on them like columns.
And the payoff query — within the first minute of having searchable logs, this surfaced failed to create fsnotify watcher: too many open files from Traefik, an inotify limit issue I'd never have found in Datadog because I never looked. Logs you actually browse beat logs you theoretically have.
Killing Datadog properly
Removing the HelmRelease from Git wasn't enough (my Flux setup doesn't prune), and deleting the HelmRelease object wasn't enough either — the release had been in a failed state, so the Helm controller never ran the uninstall, leaving the DaemonSet and operator running headless. The full exorcism:
kubectl delete helmrelease datadog-agent -n monitoring
helm uninstall datadog-agent -n monitoring     # the release secret was still there
kubectl get crd -o name | grep datadoghq | xargs kubectl delete
Check for leftover release secrets (sh.helm.release.v1.*) when a chart uninstall doesn't seem to take — a failed install leaves them behind, and pods keep running with nothing managing them.
Part 5: dashboards as code, building my own, and a ghost story.